DDT debugger on COSMOS
A basic description on how to start a debugging session with DDT, part of Linaro Forge, on the COSMOS cluster. Job will be submitted through the Slurm batch system to the back-end nodes.
About this document
This document gives basic instruction on how to start a debugging session using the DDT debugger on the COSMOS cluster at LUNARC. This document is based on Linaro DDT version 23.0.3 currently installed on COSMOS. There is currently a centralised NAISS license hosted by NSC. The licenses are shared between the users of all NAISS systems, so please be considerate of other users regarding how many licenses you use (time and number of cores).
DDT is a powerful debugger for serial and parallel programs. The tool is developed and maintained by Linaro, (formerly ARM and ALLINEA). It is part of the Linaro Forge suite. A number of parallel programming models are supported. This includes MPI, OpenMP and a number of GPU languages. This document is not a DDT userguide, we refer our users to the documentation available from the Linaro website, in particular their DDT user guide.
Getting started with DDT on COSMOS
Connect to COSMOS via the LUNARC HPC desktop
To use DDT you need to be able to access its graphical user interface (GUI).
The recommended way to connect to the system is via the LUNARC HPC desktop, which uses Thinlinc.
Starting the DDT GUI on COSMOS
LUNARC currently recommends using reverse connect to start DDT. Load the relevant module. On COSMOS the module name is linaro_forge. Load it with:
You can now start the GUI by typing
at the command prompt. This will bring up the following GUI window
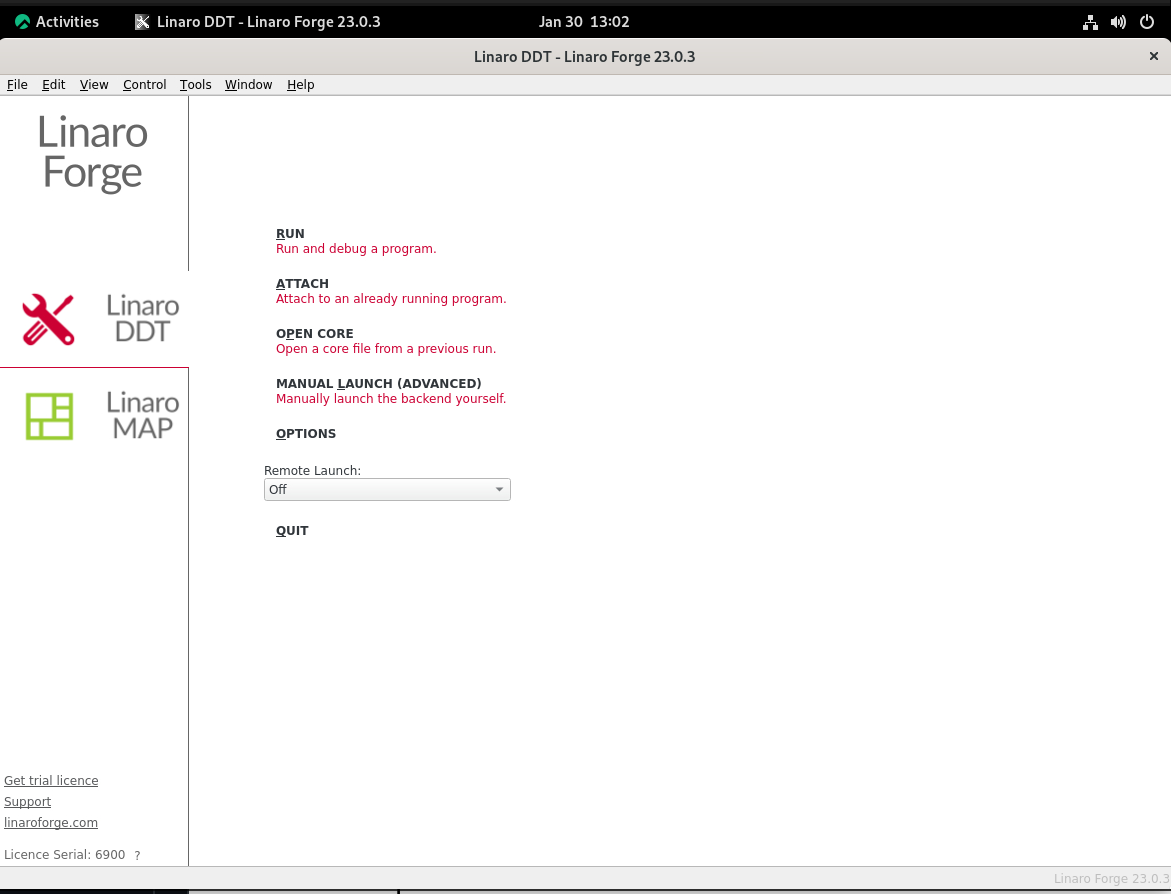
In the bottom left hand corner you get confirmation whether you managed to reach the license server at NSC.
Preparing and running your executable
We have seen issues when sources and/or executables are placed on the /lunarc file system (nobackup space). Copying sources and executables into your home space typically solves the issues.
You need to prepare your executable for debugging. Please recompile and relink everything with debugging support and without optimisation. To do so, for most compilers you need to add the flags
Once your created an executable with debugging support, run it using either a batch script or an interactive session.
Make sure the linaro_forge module and all other modules needed to run your executable (GCC, OpenMPI, SciPy-bundle, ...) are loaded by your script or manually inside your session, before starting the executable.
To start your program, prefix the execution statement with ddt --connect. For example an MPI code compiled against an OpenMPI-library should be started as follows
with the executable being named program_g. If you are using mpi4py, between mpirun and the name of your executable, you will need to insert python3 %allinea_python_debug%. In case of the Intel MPI-library the code gets started using srun
Once your job starts running, you will get a request to allow your job connecting to the DDT GUI

Accept this to get to the next window.
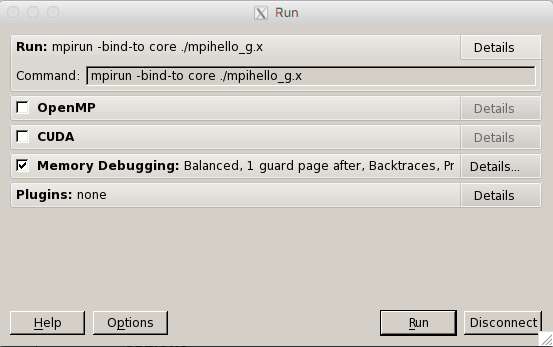
In this window you can select the features of ddt which you require. We would like to point out the Memory Debugging, which can be extremely useful when trying to resolve segmentation faults and memory leaks. Please consult Allinea's user guide for more details and side effects (e.g. increased memory consumption) of using this feature.
Hit the run button to start the debugger window
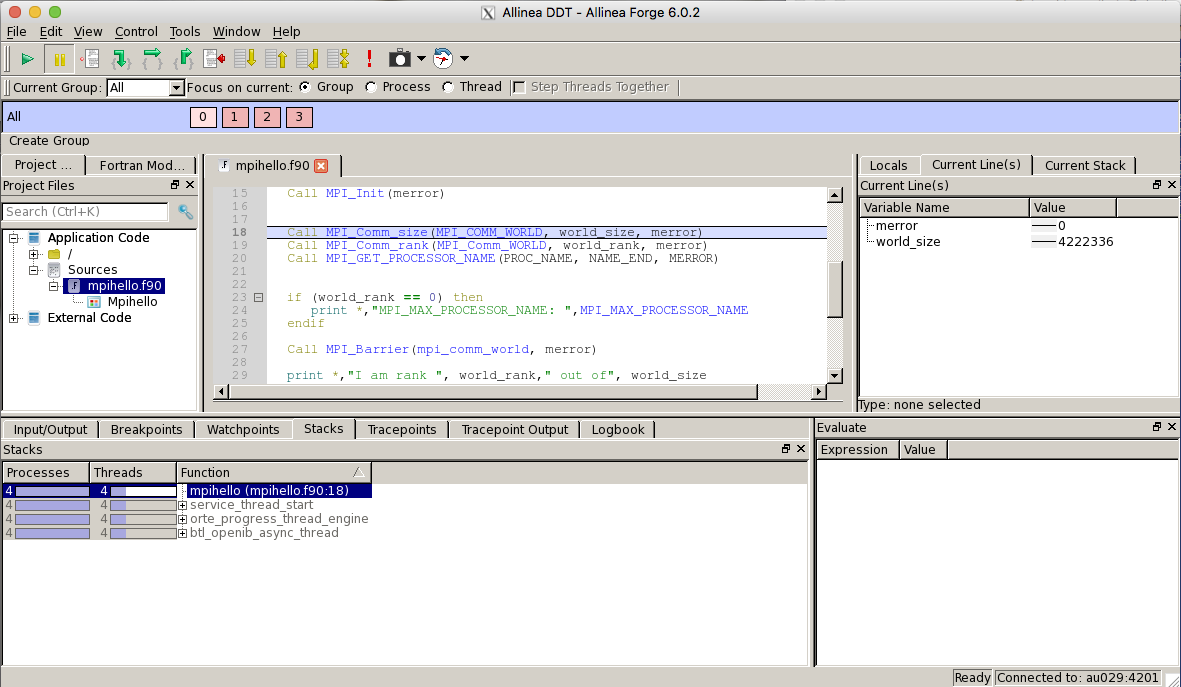
In the GUI you can run your code (parallel or serial), set breakpoints, examine values of variables and data structures.
During a debugging job it is often required to restart the program execution from the beginning. We recommend not to choose the Restart Session option from the File pull down menu to restart the programs execution from the beginning:
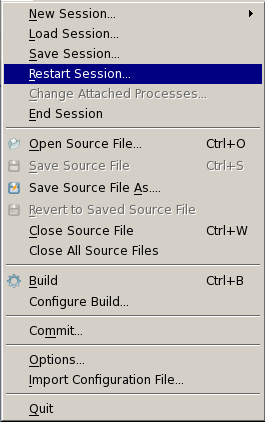
In particular when using DDT from a batch script, using this option will keep your script active and you do not need to re-queue.
If you want to start over for e.g. changing the level of memory debugging, we recommend using the End Session option from the File pull down menue:
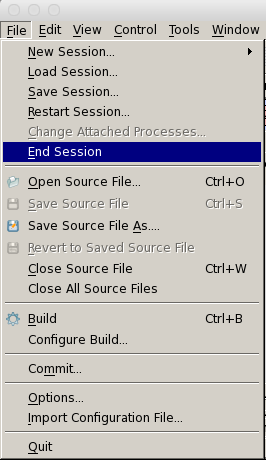
Using this option will terminate the ddt execution, but keep the GUI alive, which is often advantageous when using ssh -X to connect to the cluster. If working from a batch script, its execution will then continue to the next line(s) which typically leads to the script finishing and requires you to re-queue. An interactive session will keep running, if the time limit has not been reached.
Author: (LUNARC)
Last Updated: 2022-10-05